2022 ESG Report
We work with customers and suppliers throughout our value chain to find innovative ways to reduce packaging, increase resource efficiency, and improve environmental impacts. Read on for testimonials from PPG customers who are using PPG products to help meet their sustainability goals.

ZEISS Vision Care
"At ZEISS Vision Care, we are integrating sustainability into our core business and daily operations as we move toward carbon neutrality and resource-efficient manufacturing. To achieve our ambitious goals, we work with partners who share our sustainability values. As strategic partners, PPG and ZEISS support each other in exploring new approaches and implementing solutions that make a positive contribution to climate and environmental protection and a sustainable future."
Dr. Michael Hentschel, head of technology and innovation, ZEISS Vision Care

Skaarup Malerfirma A/S
"PPG is a long-term partner to Skaarup Malerfirma A/S and provides sustainable solutions that further our sustainability ambitions. Recently, PPG delivered putty in 1,000-liter tanks, which has minimized the use of plastic and packaging in general. The company also ensures they are using recycled plastic for deliveries wherever possible. With PPG recycled packaging, and sustainable products and solutions, we are always equipped with a strong sustainable offering and we continue to be a trusted supplier to our customers."
Martin Skaarup, owner and director, Skaarup Malerfirma A/S
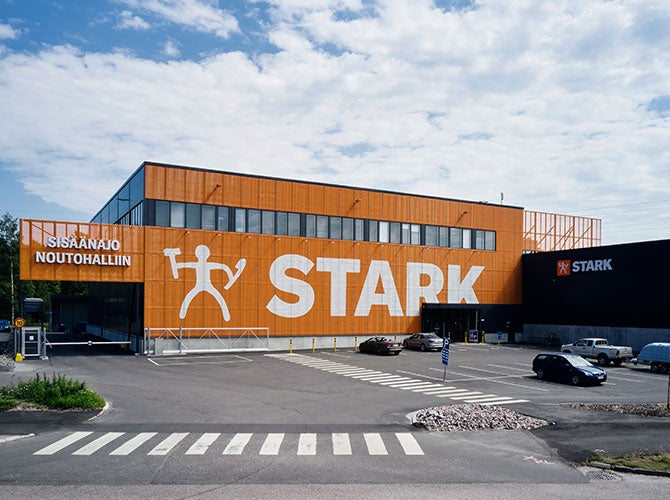
Stark Finland
"For Stark Finland, supply chain sustainability is crucial for our shared future and for mitigating climate change. We value suppliers who are committed to supporting sustainability and who take environmental, ethical and social issues into account in their operations and strive to improve quality and performance in these areas. PPG takes into account responsible sourcing, resource-efficient production and sustainable products, and supports our sustainability targets to promote sustainable development throughout our value chain. Working with PPG enables us to provide our customers with long-lasting, high-quality, sustainable paints for different purposes, and it is an important part of our sustainable supply chain."
Anne Koskinen, head of sustainability, Stark Finland
Learn more about our sustainable innovations.

Learn More
We are committed to transparent reporting on our ESG performance. Keep reading to learn more about how we are helping protect and beautify the world.